Small businesses can better compete with their larger competitors by using sales data to learn how to increase sales among different audiences.
Analyzing information about successful sales can help a marketing team understand why a sale took place, while analyzing information about lost sales can help companies make changes to capture potential customers who might decide to go elsewhere.
What data should you collect?
There’s almost no piece of data that can’t be helpful if it’s combined with other information to create reports that show patterns. The trick is to get data that clearly shows patterns, problems or opportunities. That often requires combining two or more pieces of data.
For example, do you really care if someone purchased one of your red widgets during the morning or afternoon? Maybe. If you run a variety of analyses, you might find that people who purchase more than one unit usually shop during weekday mornings.
For this reason, it’s important to write a comprehensive list of factors that pertain to sales, whether or not you think they impact your sales. You can always delete data categories later, but you might not be able to review important data combinations in the future if you don’t collect enough information at the start.
Data granularity
Data granularity simply means the detail with which you capture your data. For example, if you collect a customer’s complete address in one field, rather than using separate fields for street number and name, city, state and zip code, your data is less granular.
If you wanted to see if customers in a certain zip code (closer or farther from your business location) shop differently, you can’t do that if you don’t collect zip codes in their own fields.
This is an important decision to make as you’re deciding how to collect sales data because the more granular your data, the more different analyses you can run. It might seem that getting loads of raw data might overwhelm you, but you can request that your data be simplified.
Raw vs. simplified data
Depending on how much data you’re collecting, it can be difficult to sift through the results.
Raw data
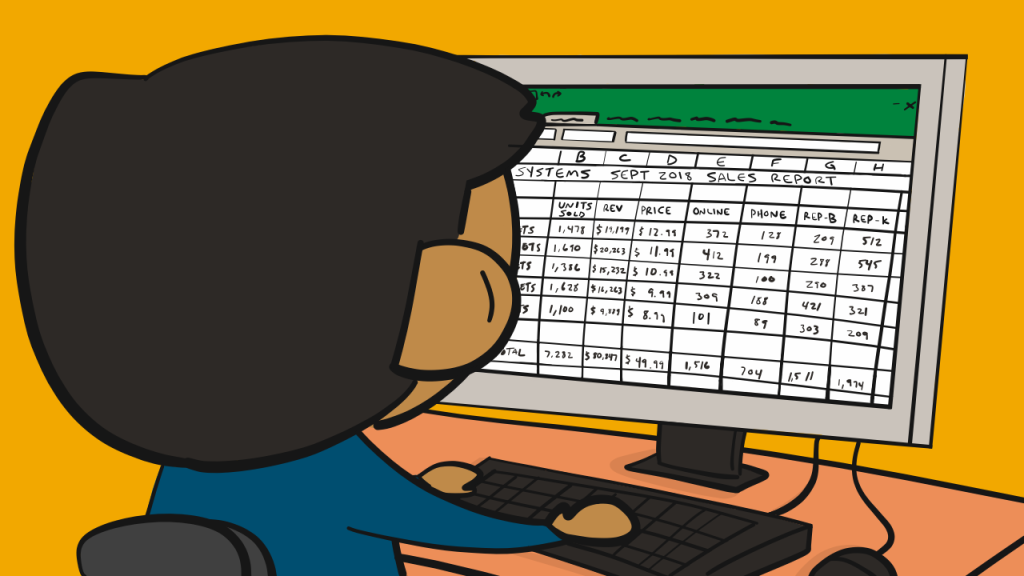
Raw data is simple pieces of information that often don’t relate to other pieces of data. For example, you might receive a long list of data that shows you how many widgets you sold, the price of each widget, how many you sold online, how many you sold over the phone, the total revenues from each type of widget sold, the zip code of the buyer, the time and day of the sale and many other single pieces of data. This raw data doesn’t tell you how many blue widgets were sold online in zip code 60137. You’d have to run a sort to find that out.
Exhibit 1 – Raw data

Simplified data
That’s why you might ask for some of your data to be simplified. In many cases, raw data can be helpful, such as your total sales for the month, or the sales numbers for each of your sales reps. However, if you want to know where your sales came from (e.g., blue widgets vs. red widgets, or online sales vs. phone sales) you want your data simplified.
For example, instead of just getting data that shows the number of widgets you sold, you might get reports that show you the number of widgets you sold by price during the week, and during the weekend. You might get your results delivered showing you your sales of widgets after shoppers sort their initial search results (i.e. sorted by price low to high or by review rankings).
You can have data simplified any number of ways to make it quicker to get answers to questions your sales and marketing team have.
In Exhibit 2, the raw data has been sorted. (Click on the document image to see it more clearly.)

You can run new reports each time you collect raw data using any combination of data sets you request, but this takes time and requires that someone who knows your data software is able to do the sorts. The simple way to run sorts is using a simple software spreadsheet program like Excel. This allows you to get your data sorted by product, price, sales channel or other parameters. If you have an e-commerce website, you’ll want much more information than just two or three combinations of data. You’ll want to know how you acquired your customers, what their keyword searches were, how they filtered their search results, how they responded to any of your popups at checkout, etc. And you’ll want to run these sorts based on new visitors vs. first-time visitors, visitors on phones vs. visitors using a desktop computer, etc.
To sort data in Excel, highlight the information you want sorted, then click on the “Data” tab at the top of your screen. Select “Sort” from the list of options, then choose the column you’d like to sort, and whether you want the data ranked from highest to lowest, or lowest to highest.
Here’s an example of a simple sort that will provide useful information for a sales team that wants to know which products are its best online sellers. It shows your widget sales ranked by how many you’ve sold online. The other categories don’t need to be ranked in any order if all you want to know are which are your best online sellers.
Exhibit 3 – Best Online Sellers – (Click on the document image to see it more clearly.)

Here’s another sort that can provide valuable information. It shows which of your widgets are being returned the most. You first see that your brown widgets are being returned by customers more than your other widgets. Scanning the data, you also see that brown widgets are your lowest-priced product, have the lowest total unit sales and provide the least amount of revenue for your company. Using this information, you might decide to stop selling your brown widgets and check to see if this results in increased sales of your next-cheapest widgets, which are your yellow widgets. Or, you might decide to do some research and find out why the brown widgets are being returned.
Exhibit 4 – Number of Widgets Returned – (Click on the document image to see it more clearly.)

Getting simplified data to your sales and marketing team helps provide insights, not just information.
You can run new reports each time you collect raw data using any combination of data sets you request, but this takes time and requires that someone who knows your data software is able to do the sorts. The simple way to run sorts is using a simple software spreadsheet program like Excel. This allows you to get your data sorted by product, price, sales channel or other parameters. If you have an ecommerce website, you’ll want much more information than just two or three combinations of data. You’ll want to know how you acquired your customers, what their keyword searches were, how they filtered their search results, how they responded to any of your popups at checkout, etc. And you’ll want to run these sorts based on new visitors vs. first-time visitors, visitors on phones vs. visitors using a desktop computer, etc.
If you have more complex data and don’t have an IT expert in your office, you can use turnkey sales data analysis programs that let you present your data in columns, graphs or pie charts.
Data to capture
Ask your sales and marketing team to create a list of the different pieces of data they want to capture so you can set up your data collection function. Common pieces of data include:
- Product name
- Product type
- Cost
- Weight
- Color
- Model number
- Part number
- Shipping option
- Distribution channel (i.e., online, catalogs, in-store, direct response, sales rep)
- Quantity ordered
- Days and times ordered
- Profit margins
- Coupon used (e.g., paper, digital code)
- Buying platform (i.e., mobile, tablet, desktop)
Your sales data should include the keywords, phrases, part and model number or other information customers type when visiting your site.
Analyzing won sales
It’s not enough to know what’s selling and who’s buying. To maximize your company’s sales, you want to know why they bought. This will require you to look at sales and marketing data from different stages of the marketing funnel.
Different stages include pre-acquisition of visitors, such as your advertising, social media, direct mail, sales calls and other techniques that put customers in contact with you. The next stage is the shopping phase, where customers are evaluating your products. Then comes the decision phase, where customers say yes or no, and what they decided to purchase, how many, etc.
You then need to analyze the checkout phase, where customers pay for their purchases. This would be the point in online sales where customers go to the checkout cart, choose their shipping method and respond to your attempts to up-sell them. In-person sales (e.g., at a store counter) at this phase include decisions about payment type (cash, credit, debit), use of a coupon, impulse buy at the counter, etc.
To analyze data from the shopping phase, you would look at keyword searches during ecommerce buying, or questions asked of phone customer service reps or directly to salespeople.
Analyzing lost sales
Take a look at all of the sales you’ve lost to try and determine why. For example, with e-commerce sales, you might be losing people who decide your shipping costs are too high. You might lose most of your customers at the shopping phase when their searches result in a “You’re search did not produce any results,” message. You might find that you convert more shoppers who filter their product search results by reviews, but lose many shoppers who filter results by price low to high.
Sales people should be given sheets to fill out immediately after each sales call to record customers’ questions, objections or reasons for saying no, and questions or positive remarks from customers who make a purchase so this data can be entered into spreadsheets with other sales information to help you look for patterns.
Look for patterns
The single most important aspect of structuring, collecting and analyzing sales data is looking for and finding patterns. Once you spot patterns, you must then ask, “Why does this pattern occur?”
Asking this question will help you recreate your sales and marketing techniques that help create positive patterns and eliminate negative patterns.
This will require you to make sure your sales and marketing team work closely with your data provider to make sure you collect the right data and sort it in ways that help you predict the future, not just understand the past. You shouldn’t focus on trying to predict future sales numbers, but instead future behaviors.
Even if you’re a small office using Excel spreadsheets to sort and analyze your sales data, you can use many techniques to review the same data in different ways.
You can use other software programs, as well, including your website analytics. If you have an e-commerce site, you might have an analytics program that comes with the site, which lets you sort your data based on your needs. You can use Google’s free analytics tools, which provides a wide variety of sorts and data categories, or one of the turnkey software programs mentioned earlier.
Running “if this occurs/then that occurs” will help you steer customers to where you want them at each step in the sales funnel. If possible, don’t just administer customer surveys to purchasers. See if you can find out what non-buyers look for in a product and seller.
Another way to analyze data is to look for reasons you have certain data. For example, look at your product returns several ways. If your returns for some products are coming mostly from online buyers and you have few returns from that product when it’s sold by a sales rep, it might be that the product is too confusing to use without instruction. Buyers who buy it from a rep get some instruction during the sale, that’s why these buyers don’t return the product. This data analysis will tell you that you need to provide better written instructions and/or create an online or video tutorial for online buyers.